
The table visualizes the variability of the Top 20 teams in the SAVAGE rating system. The bars represent the bounds on the teams performance
Read More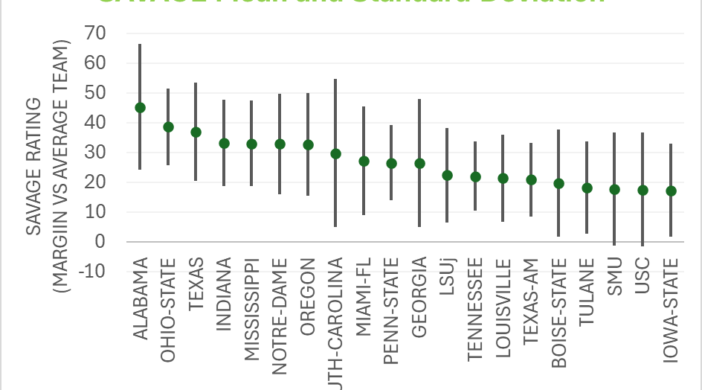
The table visualizes the variability of the Top 20 teams in the SAVAGE rating system. The bars represent the bounds on the teams performance
Read More
Preseason NCAA College Football Rankings are available… Game predictions are coming soon
Read MoreA little tongue-and-cheek but celebrating the 2020 holidays like normal could be twice as risky as base jumping. Since I have a sports analytics
Read MoreWeek 15 college football picks versus the line from the SAVAGE Ratings algorithm (56% this season). Past performance is no guarantee of future results:
Read More