

The 2016 offensive SAVAGE ratings are based on last years performance as well as the number of returning starters.
Comprehensive SAVAGE rankings available here: Complete Rankings
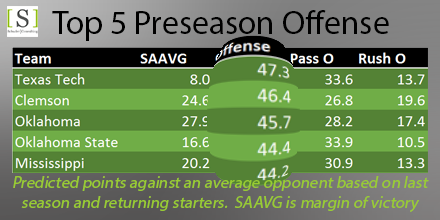
SAAVG – Margin of victory against an average team
Offense – Points scored against an average team
Pass O – Points scored through the air against an average team
Rush O – Points scored on the ground against an average team
Top 25 Offenses
| Team | SAAVG | Offense | Pass O | Rush O |
| Texas Tech | 8.0 | 47.3 | 33.6 | 13.7 |
| Clemson | 24.6 | 46.4 | 26.8 | 19.6 |
| Oklahoma | 27.9 | 45.7 | 28.2 | 17.4 |
| Oklahoma State | 16.6 | 44.4 | 33.9 | 10.5 |
| Mississippi | 20.2 | 44.2 | 30.9 | 13.3 |
| Baylor | 17.7 | 43.9 | 24.3 | 19.6 |
| Tennessee | 23.8 | 43.7 | 19.4 | 24.4 |
| Boise State | 14.9 | 43.3 | 29.7 | 13.6 |
| Tulsa | 1.0 | 43.2 | 30.1 | 13.1 |
| Oregon | 5.1 | 43.0 | 19.7 | 23.2 |
| North Carolina | 17.9 | 42.9 | 21.9 | 21.0 |
| Western Kentucky | 12.3 | 42.3 | 30.2 | 12.0 |
| Houston | 20.4 | 41.6 | 23.0 | 18.7 |
| Notre Dame | 16.3 | 41.5 | 23.9 | 17.6 |
| Bowling Green | 13.1 | 40.8 | 27.8 | 13.0 |
| Nebraska | 10.6 | 39.5 | 24.5 | 15.1 |
| Alabama | 25.4 | 38.9 | 18.4 | 20.5 |
| Southern Miss | 9.4 | 38.8 | 27.6 | 11.2 |
| Florida State | 20.5 | 37.9 | 22.2 | 15.8 |
| Western Michigan | 8.8 | 37.4 | 23.1 | 14.2 |
| Ohio State | 21.2 | 37.0 | 18.2 | 18.7 |
| TCU | 10.9 | 36.6 | 24.5 | 12.1 |
| Appalachian State | 16.4 | 36.6 | 16.6 | 20.0 |
| Stanford | 14.9 | 36.5 | 17.8 | 18.7 |
| West Virginia | 15.2 | 36.4 | 19.0 | 17.4 |